Energy Management & Automation Platform
How does it work?


Energy Management Modules


Understand your sensor data and control your assets with through the cloud


Flexible
Network
Options
H2O
IOT
BTU
BTU VARIABLES:
-Intake Temperature [°C]
-Exit Temperature [°C]
-BTU Counter [BTU ]
-BTU Energy [wh]
GAS

GAS VARIABLES:
-Intake Temperature [°C]
-Exit Temperature [°C]
-BTU Counter [BTU ]
-BTU Energy [wh]

30+ Variables we can integrate

Identify the required variables from meters and sensors
ENERGY
STEP

TRADITIONAL
OR ANALOG
METERS

Building Management Systems

SMART
METERS

Supported Protocols


OVER 8000+ METERING LOCATIONS IN 10 COUNTRIES & COUNTING
Data Transformation Stage


Data is transformed into understandable actionable information with easy to install open-source hardware


More than 20 brands and 100 devices
ELECTRICAL ENERGY VARIABLES:
-Energy [Wh]
-Controlled Energy [Wh]
-Power [W]
-Reactive Energy [VAr]
-Voltage L-N [V]
-Current [A]
-Power Factor [ ]
-Apparent Power [VA]
-Apparent Energy [VAh]
-Harmonic Distortion [THD]
-Cost [$]
-Reactive Energy Capacity [VArx]
H2O VARIABLES:
-Intake Temperature [°C]
-Exit Temperature [°C]
-BTU Counter [BTU ]
-BTU Energy [wh]
IOT VARIABLES:
-Temperature [°C]
-Humidity [%]
-On/Off [ ]
-Analog In [ ]
-Digitial In [ ]
-FlowRate [m3/h]
-Velocity [m/s]
-Net Accumulator [m3]
-Positive Accumulator [m3]
-Contador [ ]
-Pressure [PSi]
-Percentage [%]
-Distance [m]
-Energy FlowRate [BTU/h]


Data Visualization and Waste Identification Module

Set specific hours for your air conditioning units to turn on and off helps save vast amounts of energy. Also have total control you can switch on and off through our platform
Automate your A/Cs
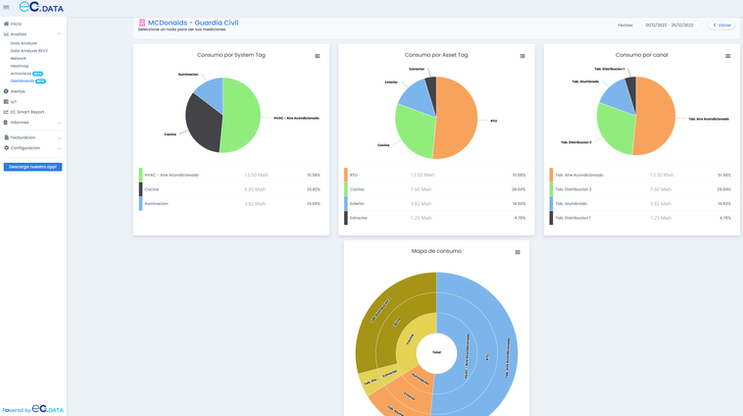
Highly Optimized 1 minute resolution data analysis module with advanced EMS features to quickly identify and understand the cost of energy assets. Data Analyzer was built by energy managers for energy managers with advanced energy specific comparisons, tariff calculations, site and assets data and much more.
_numero6.png)
IoT & Automation Modules

IoT, Meter and Sensor and Alert Module
Minutely alerting of all recorded variables with advanced escalation rules via email or mobile application.
The system records and generates an alert when a previously defined condition is exceeded. Likewise, it is possible to track all generated alerts, allowing for timely action to be taken in the event of any anomaly or deviation in energy consumption. This module also has an Android mobile application that allows for alerts to be received through a mobile device.

EC.Data
15% Discount on Yearly Plans
EC.IoT
2.75$Every monthVisualize your IoT & Sensor InformationValid for 12 months+ 30 day free trial- Unlimited Users
- 1 Minute Resolution
- EC.Data Analyzer
- EC.Alerts
- EC.IoT
EC.Automation
4.20$Every monthControl your HVAC, Lighting, Pumps and Much More!Valid for 12 months+ 30 day free trial- Upfront Pricing for Data Signals
- MQTTs Secure Communication
EC.Billing & Tariffs
5.40$Every monthTenant Billing without the HasslesValid for 12 months+ 30 day free trial- Simulate Complex Energy Tariffs
- Tenant Bills
- Integrations for ERP (SAP, Oracle, etc.)
- Best Value
EC.EMS
7.20$Every monthEnergy Management Data PointsValid for 12 months+ 30 day free trial- Unlimited Users
- 1 Minute Resolution
- Dashboards
- Smart Alerts
EC.Power Quality
18$Every monthCritical Infrastructure Waveform and Harmonics DetectionValid for 12 months+ 30 day free trial- Unlimited Users
- 10 Second Resolution
- 400 Variables for Harmonics
EC.Power Reports
3,500$Every monthDiscover the power of Customized Dashboards with PowerBI14 day free trial- Microsoft PowerBI Embed Dashboards
- Optimized Integration into EC.Data Database and APIs
- 100% Modular and Customizable
- Unlimited Dashboards*
- Personalized Dashboards Services Available


